In any modern retail business, data plays a crucial role in improving operations, customer experience, and decision-making. Designing a data warehouse for a grocery store like Woolworths requires a clear understanding of business needs, structured data modeling, and reliable ETL processes.
This article outlines a step-by-step approach to designing a retail-focused data warehouse—from identifying reporting needs to implementation and documentation.
1. Understanding Business & Reporting Requirements
Before building anything, we first need to know what the business wants to track and analyze. For a grocery retailer, key reporting needs include:
- Daily and weekly sales performance by product and store
- Inventory tracking: current stock, wastage, and reorder needs
- Promotion effectiveness: which campaigns increased sales
- Customer behavior: loyalty program usage and repeat purchases
- Supplier performance: delivery timelines and order accuracy
These goals shape the structure of our warehouse.
2. Conceptual Design
At this stage, we identify core business entities and activities without focusing on table structures.
- Entities: Product, Customer, Store, Time, Promotion, Supplier
- Processes/Activities: Sales, Purchases, Inventory movement
- KPIs: Quantity sold, Revenue, Discount applied, Stock levels, Waste
The conceptual model gives a high-level view of what information the warehouse will capture and how it relates to business goals.
3. Logical Design
The logical design turns concepts into data models. Here, we typically use a star schema for simplicity and performance.
- Dimensions:
- Product – name, category, brand, shelf life
- Customer – loyalty tier, region, registration date
- Store – location, size, opening hours
- Time – date, week, month, year, holiday flag
- Promotion – type, discount, duration
- Fact Tables:
- fact_sales – product_id, store_id, quantity_sold, price, discount
- fact_inventory – stock_level, expiry_date, wastage
- fact_purchases – vendor_id, quantity_received, cost_price
We also define relationships via keys and prepare for slowly changing dimensions (e.g., loyalty tier or product category changes over time).
4. Physical Design
Now we define how data is stored and optimized in a database like Snowflake, Redshift, or Postgres.
- Create surrogate keys for each dimension
- Use foreign keys in fact tables
- Partition large fact tables by date or store
- Add indexes for fast joins and filtering
- Create aggregate tables for faster reporting (e.g., daily sales by category)
This layer ensures the data model runs efficiently at scale.
5. ETL Implementation
Data must be extracted from various sources, transformed for consistency, and loaded into the warehouse.
- Sources:
- Point of Sale (POS) systems
- Supplier or ERP feeds
- Loyalty program/CRM
- Excel or API uploads (for small ops)
- ETL Flow:
- Staging layer – raw data, deduplicated, validated
- Transform layer – join, enrich, apply business logic
- Load layer – insert/update dimensions → load facts
- Schedule: Daily batch jobs for sales; real-time for inventory if needed
- Tools: Talend, dbt, Apache Airflow, SQL procedures
6. Cross-Check & Testing
Quality control is critical before handing over to the business.
- Row counts from source vs warehouse
- Check for duplicate records
- Validate calculated fields (e.g., revenue = qty × price)
- Backfill and reconcile for historical accuracy
- Implement alerting if something breaks (e.g., 0 sales on peak days)
7. Documentation & Handover
To ensure long-term usability:
- ERD (Entity Relationship Diagram) showing table relationships
- Data dictionary explaining each field
- ETL flowchart describing jobs and dependencies
- User guide for analysts/report consumers
- Change log for schema updates and fixes
Good documentation helps in onboarding, troubleshooting, and handovers between teams.
🧠 Key Interview Q&A
A: I would begin by gathering business requirements—what insights are needed, such as sales trends, inventory status, and promotion effectiveness. Then, I’d define key dimensions (product, store, customer) and facts (sales, inventory). Using a star schema, I’d build ETL pipelines to stage, clean, and load data. I’d also design for performance using partitioning and surrogate keys, and finally document everything with ER diagrams and data dictionaries.
📌 FAQs
It simplifies queries and improves performance for dashboard tools like Power BI and Tableau.
A unique, system-generated key used in dimension tables to ensure consistent joins and support slowly changing dimensions.
Use Slowly Changing Dimensions (SCD Type 2) to keep history and track changes over time, such as product rebranding or customer tier updates.
By applying validations in staging, using hash keys, implementing deduplication in ETL, and enforcing unique keys in the warehouse.
ERD and miscs..
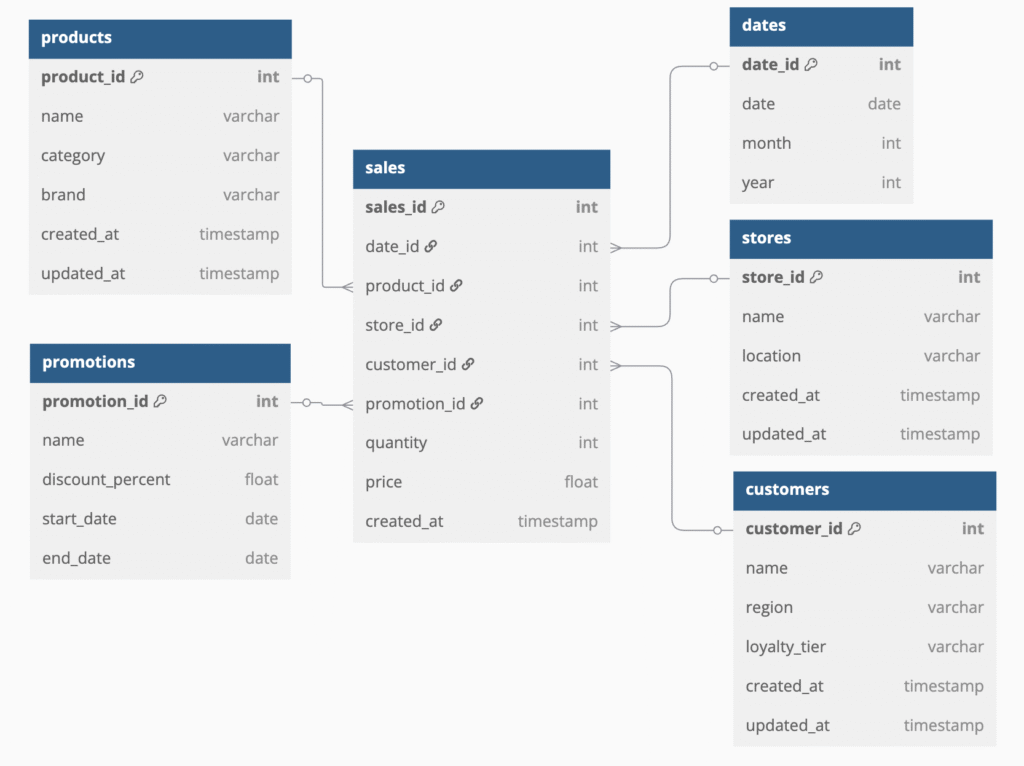
ERD designed using dbdiagram.io
// Enhanced Grocery Retail Data Warehouse with Surrogate Keys and Timestamps
Table products {
  product_id int [pk]
  name varchar
  category varchar
  brand varchar
  created_at timestamp
  updated_at timestamp
}

Table customers {
  customer_id int [pk]
  name varchar
  region varchar
  loyalty_tier varchar
  created_at timestamp
  updated_at timestamp
}

Table stores {
  store_id int [pk]
  name varchar
  location varchar
  created_at timestamp
  updated_at timestamp
}

Table dates {
  date_id int [pk]
  date date
  month int
  year int
}

Table promotions {
  promotion_id int [pk]
  name varchar
  discount_percent float
  start_date date
  end_date date
}

Table sales {
  sales_id int [pk]
  date_id int
  product_id int
  store_id int
  customer_id int
  promotion_id int
  quantity int
  price float
  created_at timestamp
}

Ref: sales.product_id > products.product_id
Ref: sales.customer_id > customers.customer_id
Ref: sales.store_id > stores.store_id
Ref: sales.date_id > dates.date_id
Ref: sales.promotion_id > promotions.promotion_id
Discover more from Data Engineer Journey
Subscribe to get the latest posts sent to your email.