Handling massive datasets can seem overwhelming, but Apache Spark makes it manageable. This hands-on guide will show you how to use Apache Spark on Databricks with a simulated electronics sales dataset. Ready to get started?
Project Downloads:
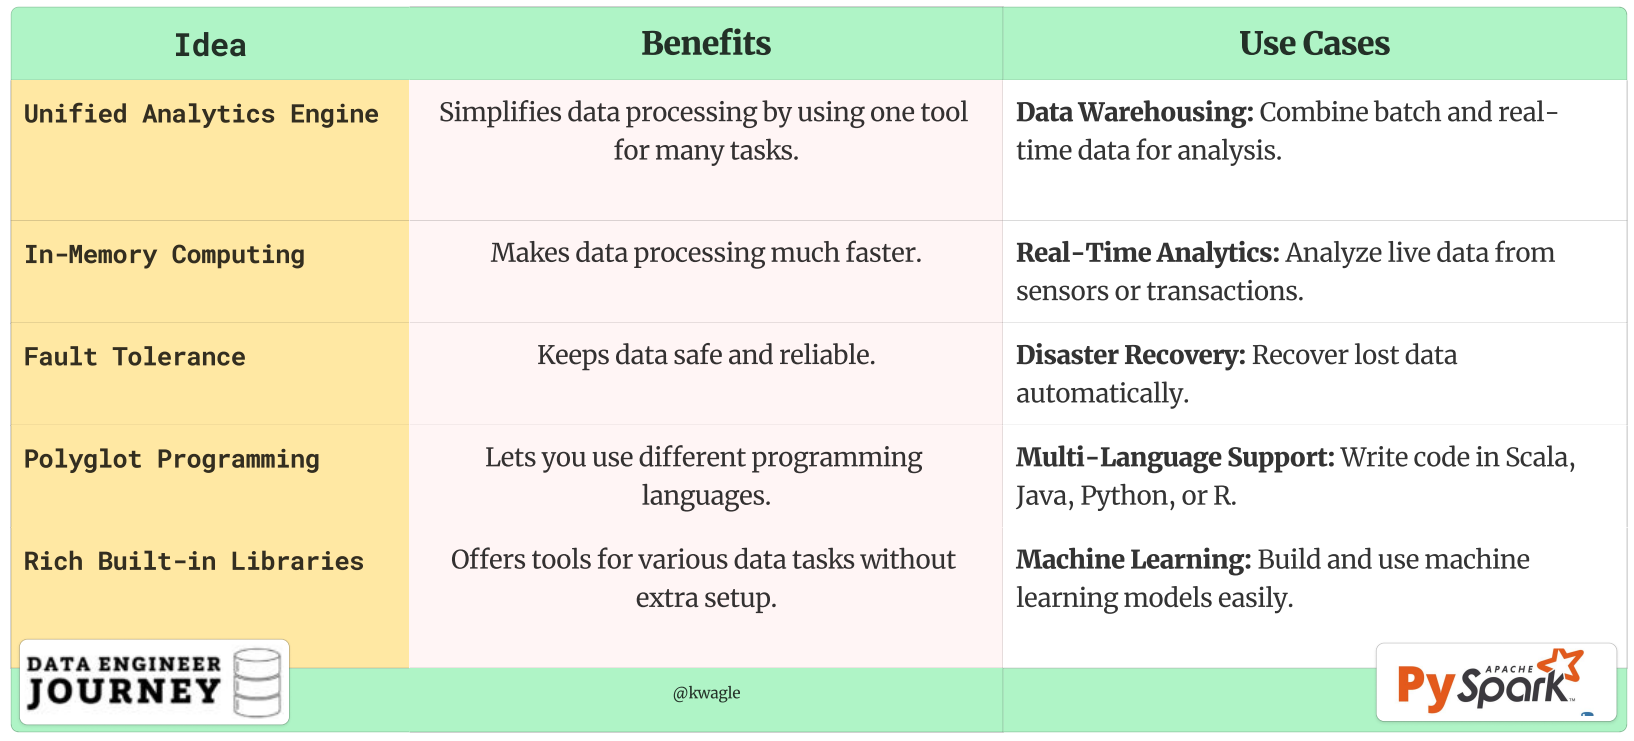
Why Apache Spark is Popular?
Apache Spark is a lightning-fast, open-source data-processing engine designed for large-scale data analytics and machine learning. It is popular because it can handle big data efficiently, offering high-speed processing, ease of use, and versatility across various data tasks…more is listed on following table with use cases.
🛠️ Setting Up Your Playground
First things first, let’s set up your Databricks environment. Don’t have an account? No worries, sign up and create a new cluster. Once you’re set, open a new notebook and let’s get started!
For those using a local notebook, make sure to install these essentials:
pip install matplotlib seaborn pyspark📊 Step 1: Creating Inline Data (with Inconsistencies)
Let’s create a DataFrame with some sample sales data, including real-world inconsistencies to make it interesting.
from pyspark.sql import SparkSession
from pyspark.sql.functions import col, sum, avg, max, min, year, month, when

# Initialize Spark session
spark = SparkSession.builder.appName("SparkElectronicsProject").getOrCreate()

# Create a list of sample sales data with some inconsistencies
data = [
    ("2024-01-01", "Electronics", 1000),
    ("2024-01-02", "Electronics", 1500),
    ("2024-01-03", "Clothing", 500),
    ("2024-01-04", "Clothing", None),  # Missing sales value
    ("2024-01-05", "Electronics", 2000),
    ("2024-01-06", "Furniture", 1200),
    ("2024-01-07", "Furniture", 800),
    ("2024-01-08", "Clothing", 400),
    ("2024-01-09", "Electronics", 1800),
    ("2024-01-10", "Furniture", 1500),
    ("2024-02-01", "Electronics", 1300),
    ("2024-02-02", "Clothing", 600),
    ("2024-02-03", "Furniture", 1100),
    ("2024-02-04", "Electronics", 1700),
    ("2024-02-05", "Clothing", 800),
    ("2024-02-06", "Furniture", 900),
    ("2024-02-07", "Electronics", 1600),
    ("2024-02-08", "Clothing", 700),
    ("2024-02-09", "Furniture", 1400),
    ("2024-02-10", "Electronics", 1900),
    ("2024-02-11", "Electronics", "N/A")  # Invalid sales value
]

# Define the schema
columns = ["Date", "Category", "Sales"]

# Create DataFrame
df = spark.createDataFrame(data, columns)
# If you had csv file named file.csv, df = spark.read.csv("path/to/your/file.csv", header=True, inferSchema=True)

# Show the DataFrame
df.show()
🧹 Step 2: Tidying Up
Real-world data is messy. How do we clean it up? Let’s handle those missing and invalid values.
# Replace invalid sales values with None
df = df.withColumn("Sales", when(col("Sales") == "N/A", None).otherwise(col("Sales")))

# Convert Sales column to integer
df = df.withColumn("Sales", col("Sales").cast("integer"))

# Fill missing sales values with the average sales
avg_sales = df.select(avg(col("Sales"))).first()[0]
df = df.na.fill({"Sales": avg_sales})

# Show the cleaned DataFrame
df.show()
🔄 Step 3: Simple Transformation
How about adding a new column for sales tax? Let’s do it!
# Add a new column with sales tax (10% of sales)
df_with_tax = df.withColumn("Sales_Tax", df.Sales * 0.10)

# Show the transformed DataFrame
df_with_tax.show()
📈 Step 4: Data Aggregation
Let’s aggregate the data to find total and average sales by category and month. Ready?
# Extract year and month from the date
df = df.withColumn("Year", year(col("Date"))).withColumn("Month", month(col("Date")))

# Calculate total and average sales by category and month
sales_summary = df.groupBy("Category", "Month").agg(
    sum("Sales").alias("Total_Sales"),
    avg("Sales").alias("Average_Sales"),
    max("Sales").alias("Max_Sales"),
    min("Sales").alias("Min_Sales")
)

# Show the aggregated DataFrame
sales_summary.show()
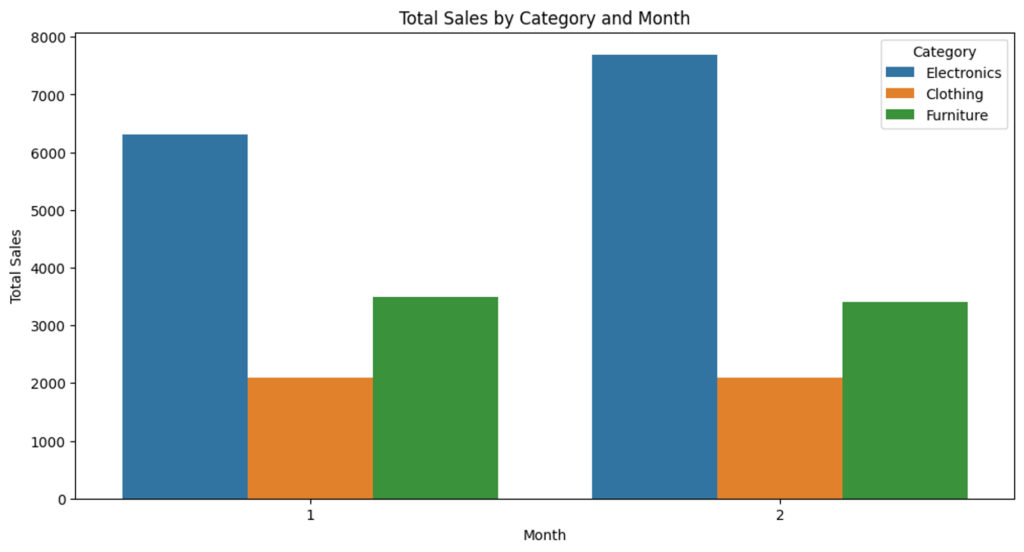
🎨 Step 5: Visualizing the Data
Let’s create some stunning visualizations using matplotlib and seaborn. Ready to see your data come to life?
import matplotlib.pyplot as plt
import seaborn as sns

# Convert the aggregated DataFrame to Pandas for visualization
sales_summary_pd = sales_summary.toPandas()

# Bar chart for total sales by category and month
plt.figure(figsize=(12, 6))
sns.barplot(data=sales_summary_pd, x="Month", y="Total_Sales", hue="Category")
plt.title("Total Sales by Category and Month")
plt.xlabel("Month")
plt.ylabel("Total Sales")
plt.legend(title="Category")
plt.show()

# Pie chart for average sales by category
avg_sales_by_category = sales_summary_pd.groupby("Category")["Average_Sales"].mean().reset_index()

plt.figure(figsize=(8, 8))
plt.pie(avg_sales_by_category["Average_Sales"], labels=avg_sales_by_category["Category"], autopct='%1.1f%%', startangle=140)
plt.title("Average Sales by Category")
plt.show()
🎉 Wrapping Up
And there you have it! We’ve walked through a comprehensive example of using Apache Spark on Databricks. From creating a DataFrame with inline data to cleaning, transforming, aggregating, and visualizing it, you’re now equipped to start your Spark adventure.
FAQs
Q1: Why should I use Apache Spark instead of Pandas?
Great question! While Pandas is fantastic for small to medium-sized datasets, it struggles with very large datasets due to memory constraints. Apache Spark, on the other hand, is designed for big data. It can handle large-scale data processing across distributed computing environments, making it much more efficient for big data tasks.
Q2: What is Databricks, and why should I use it with Spark?
Databricks is a unified analytics platform that provides a collaborative environment for data engineers, data scientists, and business analysts. It simplifies the process of setting up and managing Spark clusters, allowing you to focus on your data tasks without worrying about the underlying infrastructure. Plus, it offers built-in tools for data visualization, machine learning, and more.
Q3: How do I set up a Databricks environment?
Setting up a Databricks environment is straightforward. Sign up for a Databricks account, create a new cluster, and open a new notebook. Databricks handles the rest, providing you with a ready-to-use Spark environment.
Q4: What is a DataFrame in Spark, and how is it different from a DataFrame in Pandas?
A DataFrame in Spark is a distributed collection of data organized into named columns, similar to a table in a relational database. While it shares similarities with a Pandas DataFrame, Spark DataFrames are designed to handle large-scale data processing across multiple nodes in a cluster, making them more suitable for big data tasks.
Q5: How do I handle missing or invalid data in Spark?
Spark provides various functions to handle missing or invalid data. You can use functions like na.fill() to fill missing values or when() to replace invalid values. These functions help ensure your data is clean and ready for analysis.
Q6: How can I visualize data in Spark?
While Spark itself doesn’t have built-in visualization tools, you can convert Spark DataFrames to Pandas DataFrames and use libraries like matplotlib and seaborn for visualization. Databricks also offers built-in visualization tools that make it easy to create charts and graphs directly within your notebooks.
Q7: What are some common transformations I can perform on Spark DataFrames?
Common transformations in Spark include filtering rows, selecting specific columns, adding new columns, and aggregating data. Functions like filter(), select(), withColumn(), and groupBy() are frequently used to manipulate and analyze data in Spark.
Q8: How do I aggregate data in Spark?
Aggregating data in Spark involves grouping data by specific columns and applying aggregate functions like sum(), avg(), max(), and min(). You can use the groupBy() function to group data and then apply the desired aggregate functions to compute summary statistics.
Q9: Can I use Spark for real-time data processing?
Yes, Spark supports real-time data processing through its Spark Streaming module. This allows you to process live data streams and perform real-time analytics, making it suitable for applications like monitoring, alerting, and real-time dashboards.
Q10: What are most common Spark functions?
| Function | Purpose | Example | Use Case |
|---|---|---|---|
filter() | Filters rows based on a condition | filtered_df = df.filter(df.Age > 30) | Extract a subset of rows that meet certain criteria (e.g., age > 30). |
select() | Selects specific columns | name_df = df.select("Name") | Create a new DataFrame containing only specific columns (e.g., “Name”). |
withColumn() | Adds or modifies a column | df_with_new_col = df.withColumn("Age_Plus_One", col("Age") + 1) | Add new calculated columns or update existing ones (e.g., increment age). |
groupBy() | Groups data by one or more columns | grouped_df = df.groupBy("Category") | Group data based on certain columns (e.g., sales data by product category). |
agg() | Performs aggregate functions like sum, avg, max, min | agg_df = df.groupBy("Category").agg(sum("Sales").alias("Total_Sales"), avg("Sales").alias("Average_Sales")) | Compute summary statistics on grouped data (e.g., total and average sales). |
join() | Joins two DataFrames based on a common column | joined_df = df1.join(df2, on="Name", how="inner") | Combine data from two DataFrames that share a common column (e.g., customer info with purchase history). |
na.fill() | Fills missing values | df_filled = df.na.fill({"Sales": 0}) | Fill or replace missing values in a DataFrame (e.g., fill missing sales with 0). |
write.csv() | Saves DataFrame to a CSV file | df.write.csv("path/to/save.csv", header=True) | Save a DataFrame to a file format like CSV (e.g., export data to CSV). |
Discover more from Data Engineer Journey
Subscribe to get the latest posts sent to your email.