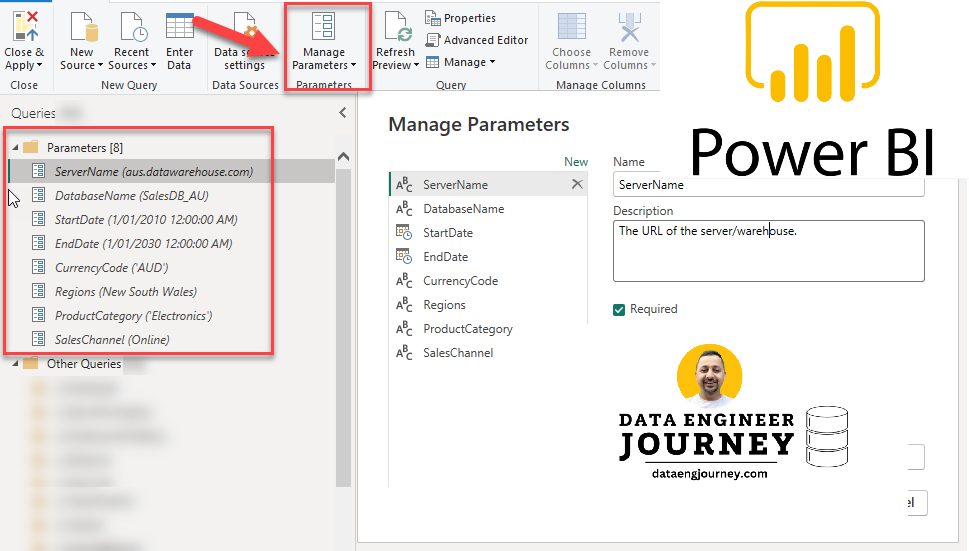
Parameters are the secret ingredient that make Power BI reports dynamic and interactive. Let’s explore some of the most commonly used parameters, see how they can elevate your reports with real-world examples, and uncover their benefits and potential challenges.

When using in power query, If needed convert the type to Text: e.g.

Common Parameters
- ServerName: Specifies the server to connect to.
- DateRange: Defines the date range for data analysis.
- CurrencyCode: Filters data based on currency.
- Region: Filters data based on geographical regions.- Array/Configuraiton Example
- ProductCategory: Filters data based on product categories.
- SalesChannel: Filters data based on sales channels (e.g., online, in-store).
Sample Usage and Power Query Examples
1. Using ServerName & DatabaseName Parameter:
Let’s say you want to connect to a PostgreSQL server dynamically based on the server name parameter.
let
    Source = PostgreSQL.Database(ServerName, DatabaseName),
    SalesData = Source{[Schema="public", Item="transactions"]}[Data]
in
    SalesData
Benefit: Dynamic Connections: Easily switch between different servers without modifying the code, making the report adaptable and reducing maintenance.
Cons: Complexity: Managing multiple server connections can introduce complexity. Ensure that server credentials and configurations are correct to avoid connection issues.
2. Using DateRange Parameter:
Filtering sales data within a specific date range.
let
    SalesData = Table.SelectRows(YourDataTable, each [SaleDate] > = StartDate and [SaleDate] < = EndDate)
in
    SalesData
Benefit: Focused Analysis: Narrow down the data to a specific time period, enhancing the relevance and accuracy of your analysis.
Cons: Performance Impact: Filtering large datasets by date range can affect performance. Consider using indexed date columns to improve query speed.
3. Using CurrencyCode Parameter:
Filtering sales data based on currency in Australia.
let
    FilteredData = Table.SelectRows(YourDataTable, each [Currency] = CurrencyCode)
in
    FilteredData
Benefit: Consistent Financial Reporting: Filter data based on currency, ensuring consistency and accuracy in financial reports.
Cons: Currency Fluctuations: Be mindful of currency fluctuations and conversions that may affect the consistency of your financial data.
4. Using Region Parameter:
Filtering data based on geographical region in Australia.

let
    FilteredData = Table.SelectRows(YourDataTable, each List.Contains(Regions, [Region]))
in
    FilteredData
Benefit: Geographic Insights: Analyze data by specific regions, providing targeted insights and helping with regional decision-making.
Cons: Data Consistency: Ensure that region names and codes are standardized across your dataset to avoid discrepancies in filtering.
5. Using ProductCategory Parameter:
Filtering data based on product categories in Australia.
let
    FilteredData = Table.SelectRows(YourDataTable, each [ProductCategory] = ProductCategory)
in
    FilteredData
Benefit: Segmented Analysis: Focus on specific product categories, allowing for deeper insights into product performance and trends.
Cons: Categorization Issues: Ensure that products are correctly categorized. Misclassification can lead to inaccurate analysis.
6. Using SalesChannel Parameter:
Filtering data based on sales channels in Australia.
let
    FilteredData = Table.SelectRows(YourDataTable, each [SalesChannel] = SalesChannel)
in
    FilteredData
Benefit: Channel Performance: Filter data by sales channels to evaluate their performance, helping to optimize strategies for each channel.
Cons: Channel Misalignment: Ensure that sales channel data is accurately recorded and aligned
Connection samples for different systems: PostgreSQL, Azure Databricks, Snowflake
PostgreSQL
Server Name: postgres.example.com Database Name: sales_db
Power Query:
let
    ServerName = "postgres.example.com",
    DatabaseName = "sales_db",
    Source = PostgreSQL.Database(ServerName, DatabaseName),
    SalesData = Source{[Schema="public", Item="transactions"]}[Data]
in
    SalesData
Azure Databricks
Server Name: adb.example.com Database Name: databricks_db
Power Query:
let
    ServerName = "adb.example.com",
    DatabaseName = "databricks_db",
    Source = Databricks.Query("driver={ODBC Driver 17 for SQL Server};server=" & ServerName & ";database=" & DatabaseName & ";",
        "SELECT * FROM transactions"),
    SalesData = Source
in
    SalesData
Snowflake
Server Name: snowflake.example.com Database Name: finance_db
Power Query:
let
    ServerName = "snowflake.example.com",
    DatabaseName = "finance_db",
    Source = Odbc.Query(
        "Driver={SnowflakeDSIIDriver};Server=" & ServerName & ";Database=" & DatabaseName & ";Schema=public;Warehouse=COMPUTE_WH;Role=ACCOUNTADMIN;",
        "SELECT * FROM transactions"),
    SalesData = Source
in
    SalesData
Wrapping It Up
Parameters in Power BI are the secret sauce that makes your reports dynamic and interactive. From switching servers to filtering by date, currency, region, product category, or sales channel, these tools transform your data analysis.
By utilizing these parameters, you create flexible, user-friendly reports that provide precise insights. Just watch out for performance and consistency issues. Experiment and see the difference they make.
Discover more from Data Engineer Journey
Subscribe to get the latest posts sent to your email.
